

TRADING GLOSSARY
You will find here a trading glossary (incomplete) that I will enrich regularly. I hope that it will help you in your trading journey.
You have a suggestion for the addition of a word, a modification or a precision to bring to a definition? Please, fill in this form:
A
Accumulation
Accumulation is the term used to describe a trading zone ( often a range) where traders are progressively buying in order to avoid too much price impact. This translates into tight price areas on a stock chart.

(click to enlarge)
Averaging down
Consists in buying or selling short against the trend. In trading this strategy leads very often to failure because it implies that no stop loss are used and the trader fights the natural trend of the market.
B
Backtesting
Backtesting is the process consisting in assessing the risk-adjusted return that would have been achieved in the past by applying a given trading strategy on the basis of technical and/or fundamental patterns.
The extensive analysis of these "virtual" trades allows the trader to establish whether his trading system generates a positive trading expectancy and to mechanically justify the strict application of the latter if this is the case.
This is said that the trader has an edge.
Backtesting tells you:
1- to take ALL the trades that your strategy commands you to take otherwise you will not be able to achieve the performance "promised" by your backtest,
2-don't take the trades that your strategy commands you to take.
A backtest must be well done on the basis of simple and coherent assumptions.
Indeed, if the inputs are not grounded in a simple and robust approach it can make the backtesting process completely useless or even counter-productive (see data ming and curve fitting).
Generally speaking, the simpler your strategy is and therefore the fewer indicators it uses, the more reliable and robust it is likely to be and therefore to stand the test of time and the inevitable changes in market conditions.
Breakout
A breakout is an upward breakout from a consolidation zone.
A breakout strategy has the advantage of never missing a bullish move in trend following.
The flip side of this approach is that many breakouts end in failure. But this is true for any trading strategy.
Bear market
A market falling by at least 20% from the previous high during a significant period of time.
Behavorial finance
Behavioral finance challenges the assumption that the investor is supposed to be rational and invest based on all available information. It takes into account the many psychological traps that humans suffer from when it comes to investing, such as loss aversion, herd bias, and many other biases that lead to market anomalies such as bubbles and crashes.
Bottom fishing
Bottom fishing is a trading or investment strategy that consists of buying a stock (or more broadly a listed asset) at or near its lowest level over a given period of time.
The low considered can be the historical low, i.e. the lowest ever reached by the stock or the lowest over a period of one year, two years or more.
Bottom fishing can be approached from a fundamental or technical perspective or both.
It is a strategy that can pay off by trying to play breakouts on these price levels.
Moreover, on these price levels, many traders are shorts which can accelerate the recovery movement if the stock decides to break upwards on favorable technical setups.
The number of failed breakouts from the top can be significant, however, as the stock is subject to continuous sell orders at the slightest recovery, both for fundamental and technical reasons.
Bull market
A rising market for a significant period of time
They can give the false impression to the majority, especially the "weak hands", that the movement will not stop. However, a bear market or at least a period of consolidation will systematically follow a bull market.
C
Cognitive bias
Psychological biases that stem from a bad way of processing information (statistical, memory errors) as opposed to emotional biases which are related to the overrating or underrating weight for a give piece of information according to greed, hope and fear.
Cup with handle
The price pattern follows the shape of a cup with a handle.
The first movement is an upward move followed by a slight recovery notably halted by a selling current of those who have been stopped out on the high side of the structure and want to minimize costs by anticipating the high in question (breakeven resistance level). The handle is the price level where the traders who anticipate the resumption of the upward movement start accumulating their position (volumes often dry up) while the impatient « weak hands » jump ship before seeing the stock break out to the upside and start its upward movement, without them...
(click to enlarge)
D
Descending wedge

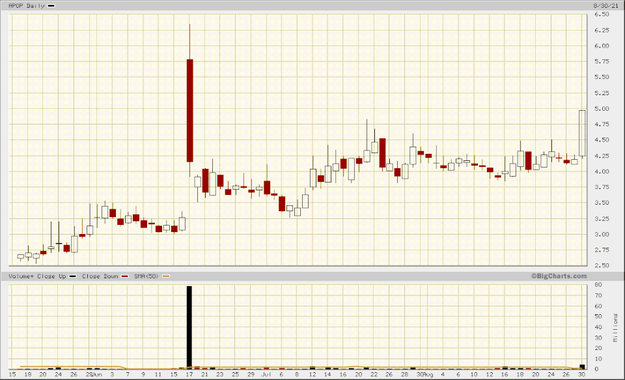
Distribution
Distribution signals that a significant number of traders are getting out of a position. You can see it on a chart with an increasing in volumes accompanied by falling or stagnant prices.
Double bottom
(click to enlarge)
E
Emotional biases
Pscyhological biases stemming from emotional and irrational reactions to a specific situation.
The main psychological biases are:
"LOSS AVERSION" BIAS (reluctance to take losses and inclination to take small gains),
"OVERCONFIDENCE BIAS",
"SELF ATTRIBUTION BIAS" (focus on short term satisfaction at the expense of higher long term monetary outcome),
"STATUS-QUO-BIAS" (not changing or adapting to the dynamic behavior of the market),
"REGRET AVERSION BIAS" (fear of commission or omission leading to wrong trading decisions. Fear of commission is greater than the fear of omission).
F
Flat base
(click to enlarge)
Consolidation zone during which prices remain contained at close levels.
It is mechanically associated with a more or less prolonged period of hesitation or accumulation by strong hands (see accumulation).
A break above or below this zone very often initiates the beginning of a trend in the direction of the break.
The flat base is often part of a more general pattern of volatility compression.
Fundamental analysis
Fundamental analysis consists in the analysis of a company’s financial statements in order to assess its financial health and to determine whether there is a discount between the market value and the estimated value.
If the estimated value is higher than the market value, then it makes sense to buy, the asset being considered undervalued.
If not, it is considered overvalued and it is recommended not to invest, to sell it if it is already held in the portfolio and even to sell it short.
The value approach, whose founding father was Benjamin Graham and whose most illustrious disciple is Warren Buffet, is the core business of many investment funds.
Fundamental analysis can be coupled with chart analysis to optimize the entry and exit points.
G
Gap
A gap is the difference between the last quoted price and the opening price of a given asset.
An upward opening gap is when a stock opens at a higher price than the last quoted price.
A downward opening gap is the difference between the last quoted price and the opening price, which this time is below the closing price.
Gaps can happen more rarely during the trading session when a stock is halted and opens at a price higher or lower than the last quoted price.
Gambler fallacy bias
A cognitive bias which leads the trader to make the assumptions that sequences of trades are dependent of the way they are distributed. For example, thinking that because a trader suffers 3 losing consecutive trades implies that the 4 th trade has a higher probability be a winning one.
H
Halted
Situation where a stocks quotation is « halted » because of an excessive demand or offer.
Hit ratio
The hit-ratio is one of the often overestimated components of trading gain expectancy which is the percentage of winning trades produced by a given trading system.
A hit ratio of 30% means that 30% of your trades are winners.
Novice traders are often under the illusion that they need to magnify this ratio. However, the most profitable strategies often have a hit ratio below 50%.
In fact, a high hit ratio is often associated with small gains (it is easier to capture a 5% movement than a 20% variation) which do not always compensate for the losses (see risk aversion and risk reward ratio) generated by the trading strategy.
I
J
Hh
K
L
Limit order
Order that sets a price limit but without guarantee of execution on all the securities requested or offered.
Line of resistance breakout
Long
Loss aversion bias
Emotional bias that consists in refusing to take losses and quickly cutting your gains. This human psychological bias is very hard to get rid of and is the cause of much damage in trading.
It comes from an asymmetry between the emotional charge caused by a gain and that associated with a loss. It makes us inclined to take our gains quickly and let our losses run.
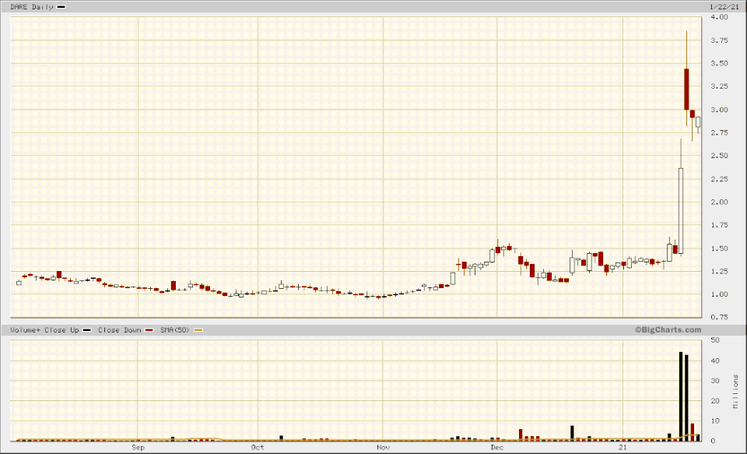
Loss hunt
A situation which describes the " so-called" manipulation of brokers or big pocket insitutional traders who supposedly would hunt the stop of retail traders. Once stopped out, traders see the price go in the direction initially expected without them. When there could be unscrupulous brokers implementing such illegal activities, the reality is that most hedge funds or big market participants are constantly in search for liquidity pockets to enter the market with big position sizes. Most retail traders put their stops at obvious levels which can offer optimal conditions for a good entry to better informed market participants (see related term "Weak hands").
M
Market order
An order that requires execution on all securities held at the best price accepted by the selling or buying counterparty.
Max drawdown
The maximum drawdown is the maximum amplitude expressed in % between a high reached by your equity high and a later low. This is usefull to compare your performance to your maximum drawdown. Basically, if your drawdown is higher than your peformance, you take too much risk for a given level of performance.
MOC order
Order placed near the end of the trading session (about 10 minutes before the close depending on the market traded), enabling to trade the closing price.
N
O
Overnight risk
Risk exposure stemming from holding a position after the market closes.
P
Psychological biases in trading
Market is an unatural environment where most of our natural inclination to do things as human being play against the trader.
This is said that 90% of success in trading comes from getting rid of those psychological pitfalls generally grounded into fear, greed and hope.
We make the distinction between cognitive biases which comes from wrong way of analyzing, processing or remembering information and emotional biases purely linked to emotions.
Those pyschological biases have been highlighted by behavorial finance.
(see related term "cognitive biases" and "emotional biases" and "behavorial finance").
Position trading
Trading strategy whose holding period can last from a few months to several years.
Pivot point
A pivot point is the term used to describe the optimal price level for entering a trade which both potentially maximise your risk-reward ratio, confirms (if the trade goes in our favor) or infirms (if the trade goes against us ) the quality of the setup which motivated the trade.
Q
R
Risk management
Risk management in trading is an overused term that is often misused to such an extent that we end up losing its meaning and importance.
There is the risk management per trade which concerns the risk of loss induced by taking a position (see stop loss), the global risk of the portfolio (the risk of seeing all the trades of the portfolio exceeding the individual authorized limit at a given time) and finally the risk of portfolio volatility on opened positions which represents no more and no less than the fluctuations of the value of the portfolio compared to its average value.
One measure of risk is the maximum drawdown, which measures the maximum difference between a high and a low reached by the portfolio over a given period.
(see volatility and maximum drawdown).
Risk-reward ratio
The risk-reward ratio is the most overlooked component of trading gain expectancy, and wrongly so.
It is calculated by dividing the average gain by the average loss, both expressed in currency units or as a percentage. A risk-reward ratio of 3 indicates that on average your average gain is three times your average loss, or in other words, you get 3 out of risking 1.
In this case, if your risk-reward ratio is 3, your break-even hit ratio (see hit ratio) is 1/(1+3)= 25% of winning trades.
This means that you start making above 25% of winning trades.
The risk-reward ratio is the parameter that has the most influence on your performance and also often gives a good indication of the robustness of a whole trading system.
The higher your risk-reward ratio, the less you depend on your hit ratio (% of winning trades).
Risk per trade
Maximum risk taken when entering a trade relating to you whole trading account. In order to avoid the risk of ruin, this is said that you should not risk more than 1% of you capital on any given trade.
20 consecutive losses with a 1% risk per trade lead to a total loss (relative to your trading capital) of 18,21% and not 20% (the compounding effect of losses is made on a decreasing basis).
20 consecutive losses with a 2% risk per trade lead to a a total loss of 33,24% and not 40% (the compounding effect of losses is made on a decreasing basis).
(see related term "risk management").
S
Scalping
Trading strategy which consists in taking trades on very small time scale with an average holding period between few seconds up to a few minutes. High liquidity is required. Major index futures are often traded.
Swing Trading
Trading style consisting in taking trades and holding them from a few days up to several weeks.
Slippage costs
Slippage costs are the difference between the decision price, that is the price when we decide to trade and the price paid for entering the trade. It basically depends on liquidity and position size.
T
Trading diary
A trading diary consists essentially in writing everything about our daily trading actions: what we have to do, what we do, what we should do to reach our goal of consistency. This has several advantages: first we retain more information by writing, second writing makes us accountable for what we write, third it allows to measure the progress and fourth helps to reduce the profit gap between what is and what should be.
It works in sync with the trading journal which is the quantitative tool (statistical) while the trading diary is more a qualititative one (analytical) in an incremental process toward a quantified goal.
Trading gain expectancy
Trading gain expectancy is the term used to describe the capacity of a trading system to generate a stable positive return over time after a certain number of trades.
If your trading gain expectancy is positive you have an edge, if not you don't.
Trading expectancy is a way to determine if you are going to be profitable in the long run by consistently applying the same trading system. It is based on the law of large numbers with independent events.
For example, a casino has a positive gain expectancy, i.e. on the basis of the games it offers (which may have a different expectation of profit depending on their nature), it is virtually impossible for it to go bankrupt (apart from a management error independent of its economic model), while never knowing in advance the outcome of a single game.
This is the same model for national lotteries.
In zero-sum games, the loser's stake represents the winner's profit, which implies that players are structurally losers (they are certain to lose after a certain number of games played).
Trading, which is a zero-sum game, has the advantage of putting everyone on the same level since the expectation of winning is not imposed by the counterparty as in the previous examples (casino or lottery) but determined by the player who nevertheless decides for many reasons and often without knowing it to be a structural loser.
The expectation of profit in trading is also based on the fundamental principle of independence of the trades made. This means that the outcome of one game or trade has no influence on the game that follows despite the many psychological biases that suggest the opposite to many traders.
For example, a series of losing trades has no reason to precede a winning trade more than a losing trade (gambler fallacy bias).
If your expected gain is negative, you are sure to lose in the long run. If it is positive, your carefully executed strategy will produce steady gains, all else being equal.
The components of the expected gain in trading are the risk-reward ratio, the hit-ratio, and the position size.
Trend following
Trading system and philosophy that involves entering a trade (long or short) when a trend starts and taking the middle of the move. This strategy is supposed to be robust in the sense that it follows the natural upward or downward movements of assets without psychological biases. It involves being in many different, uncorrelated markets (mainly futures). Trend following produces a high risk-adjusted return, but implies a low hit ratio (many unsuccessful trial) until a huge move is taken (high risk/reward ratio) and a high drawdown (we need to wait for an adverse move to consider that the trend is over).
See the excellent and exhaustive work of @covel on this trading system.
U
V
Volatility
W
Weak hands
Generic term describing uninformed and unprepared traders offering opportunities to their counterpart, that is informed and skilled traders to make money.
Weak hands are supposed to be impatient, victims of the main pyschological biases, prone to place their stops at obvious levels, entering at the highest relative high and exiting at lowest relative low.
(see related term "psychological biases", "cognitive biases", "emotional biases", "stop hunt").